During the past 6 months I have been
involved in my own investigation on the effects of temperature on seed
germination and plant establishment. In a previous field trial of beetroot only
50% of the plants emerged and it was thought this was due to several hot days.
The question arose of whether this was due to the high temperature reducing
germination or if seedlings were able to draw up enough water from the soil for
transpiration. My experiment showed that although a temperature spike increased
the rate of plant emergence, and a temperature drop slowed down emergence,
neither affected the total emerged. As a concurrent experiment I investigated
how the amount of soil moisture affected germination and emergence. I
discovered the less the soil moisture percentage the less the germination rate.
Friday 27 June 2014
Back in Wellington
19-20 June
We
had our last set of curriculum focus days. We focused on the capability of
‘critiquing evidence’. Mostly it means you need to repeat or replicate
experiments so you can gather enough data to come out with a representative
average. It also means you have to look at a range of data to look for
abnormalities, as it may mean the method wasn’t done correctly.
We also looked at a bit of transition back to school ideas. One of
the tutors was away so we had Michael Fenton as a guest tutor. He used to do
this programme but now he runs the open polytech science teaching diploma
course. As he said, they gave us seeds of ideas, a bit of a look-see into
several ideas. One of the ideas was a science table of curious objects.
 |
| our science table of curiosities |
 |
| Add caption |
 |
| a test of the power of air! ...and the strength of balloons? |
What is the most impactful science we can do?
18 June
I
read on the i-plant site a quote from the Chief Operating Officer: “The
most impactful science we can do is that which cares for the environment,
reduces waste and improves the wellness of consumers through high quality, safe
and healthy food.” I think this nicely sums up the goal of all Plant and
Food Research.
Layers of onions...
11-16 June
Today
I cut, labelled and weighed 505
onion skin samples. There are 5 plots, for each plot I chose 10 onions to take
4 core samples of the brown skin. Each sample then was separated into the
skin’s layers. Each layer was separated into a patty tin with a label. I then weighed them. Their weights ranged
from 0.2g to 0.0088g depending if I could separate the layers.
After
I had recorded all the fresh weights the samples were put into the oven for 24
hours to dry. Then each skin was weighed again to find out the dry weight.
Unfortunately
when I went to take the onions out of the oven I noticed some of the layers
separating so instead of one sample I now had 2 or 3 or in one case 6 samples!
Altogether I weighed 634 dried skin samples.
So how many of the original fresh samples separated into
more layers?
Why was I doing this? It’s an ongoing experiment looking at
quality of onions. In this case they are looking at the quality of the skins.
 |
| Taking a core sample |
 |
| weigh each layer of the sample |
 |
| label each layer of each sample |
 |
| put the samples into the oven and weigh once dried |
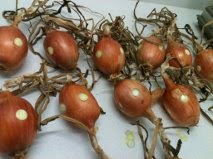 |
| 4 samples were collected from each onion |
 |
| the dried onion skins |
Sunday 15 June 2014
Beetroot Single vs Double Germination
10 April - 13 June
I have discovered that some beetroot seeds will provide two plants from one seed. I wonder if they grow as well as seeds that only provide one seed.
Hmm.. time for another experiment.
First I had to germinate enough beetroot seeds to collect at 15 doubles. Then I planted them in pots in a cross formation, with the centre being the double and the edges being singles. This is to simulate their growth in the field with other beetroot.
I also planted 15 singles in the same way. So, in all I now had 30 pots - enough replication to give a fair result.
Now to wait for them to start growing.
 |
| Germinating the seeds |
 |
| First emergence |
 |
| Counting the number of true leaves to record leaf emegence |
 |
| Measuring the length of the same true leaf each week to record growth |
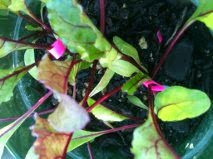 |
| A double...the pink mark the leafs I am measuring |
 |
| A single |
 |
| Uh oh! The leaves are changing colour. |
Turns out that the leaves change colour like this when they are too cold, too dark and too wet.
Bring on summer!!!
Once I have enough data collected I will compare their growth. Hopefully before all the leaves reach their senescence (die).
Tuesday 20 May 2014
Meeting up with Ellie (another teacher fellow)
9 May
Today I went to
Ocean Beach to catch up with Ellie. She is another teacher fellow from
Christchurch. She is studying Pingao plants in the sand dunes. I thought I
could give her a hand then take her into Havelock North and maybe show her here
at PFR.
She was with a
Masters student that she had been working with at Lincoln. He was looking at
analysing the terrain using a drone service to give a 2D visual representation.
He had a GPS device and an incline measurer, which he could use as well at
ground level. From what he was recording on the ground and what the drone gave
he should be able to give an accurate 3D image.
When I joined
them they told me they were looking for Katipo spider. I always thought they
lived in drift wood and not here. But I was proven wrong. Ellie and Mike had
mapped out a 200m x 5m transection from the beach inland. Then they recorded
the plant life with GPS coordinates and measured the height, width and depth of
each plant, whether they were a single plant or a group of plants, and the
incline of the sand dune. They only did this for a 5x5m plot. This became a
representation of the whole transaction. Once that was done they then checked
every plant for katipo spider, recording each one they found with their sex,
their plant host details, their web structure, and their GPS location. They
weren’t finding many but they were definitely finding some. In their first
transect they found 6 katipo.
 |
| Marking out the transection. |
 |
| Recording all the plants living in a 5m square. While Mike measures the size of the plants and the incline of the land, Ellie uses a GPS unit to record its location. |
 |
| Then its time to sit down and search in the plants for Katipo spiders. |
 |
| Can you see the web? Somewhere in this photo is a spider. I can't find it. Can you? |
 |
| Sometimes something else is found. This caterpillar has a horn. Any idea why? |
Later in the
afternoon I brought Ellie into PFR for a mini tour. She was amazed at how much
was happening in plant research.
The next curriculum days
15 -16 April
The second
curriculum courses were held in Wellington over these two days. It was also
opportunity to catch up with the other science fellows to see how they were
going.
The first day
we spent the morning looking at the first science capability of ‘using
evidence’ and unpacking what this means and how to teach it. We made balloon
racers, and then tested them. We were able to observe each other’s cars and
take some of their successful ideas and incorporate them into our adapted
design. This was using evidence we see from their success.
We did three
activities based on the sun. One was looking for places where UV wasn’t present
by using UV beads.. The next activity was using a model of an earth and sun
(lamp) to look at seasons. The last activity was using an OHP as the sun and a
model of the moon. We were the earth and turned ourselves while holding the
moon, in the light of the sun, to look at phases of the moon. The ‘using
evidence’ for these activities was prior knowledge and testing ideas.
In the
afternoon some of the fellows shared activities they had prepared around the
context Planet Earth and Beyond, and using the capability of Using Evidence.
The other fellows rotated around the activities and at the end they gave
feedback and feed forward for each activity. My activity was a game called
“Rock”. The participants put a rock on each square of the 4x4 grid, and then
they read out clue cards and put a counter of their colour on a rock square
that matched the description. When someone had 4 counters in a row they called
out “ROCK!” to win. The ‘using evidence’ for this activity was using the cards
as the evidence to identify the rocks.
There were
other activities such as air pressure in balloons, reading temperature graphs
to answer questions, making sink holes, making clouds in bottles, making
geysers, and water pressure. I now have plenty of PEB activities to use for
exploring the capability of ‘using evidence’.
The last activity
took us to Te Papa where we had to find the evidence that showed the link
between volcanoes and earthquakes.
The second day we spent some time looking at online
resources and planning.

 |
| Making a geyser |
 |
| Making a cloud in a bottle |
 |
| Making a cloud in a jar. |

 |
| Making a bottle rockets. |
Subscribe to:
Posts (Atom)